A data scientist, according to Harvard Business Review, is “the sexiest job of the 21st century”, and it’s pure magic when you see how all these raw data are turned into a clear prediction with definite figures. In this article, we’re going to show you the magical process of predicting sales step-by-step. It started when we got an idea to take part in a Kaggle competition for data scientists. The task was to help poor Rossmann store managers create effective schedules for their employees, basing on the predicted sales and the average check. Here we have to say some words about Rossmann stores. Rossmann is the second largest drugstore chain in Germany, founded in 1972 by Dirk Rossmann. It operates over 3,000 drug stores in 7 European countries and employs more than 28,000 people. Rossmann offers over 17,500 different items in its biggest retail outlets. Besides the pharmaceutical goods, you can also find pet food, a big choice of different wines, toys and stationery as well.
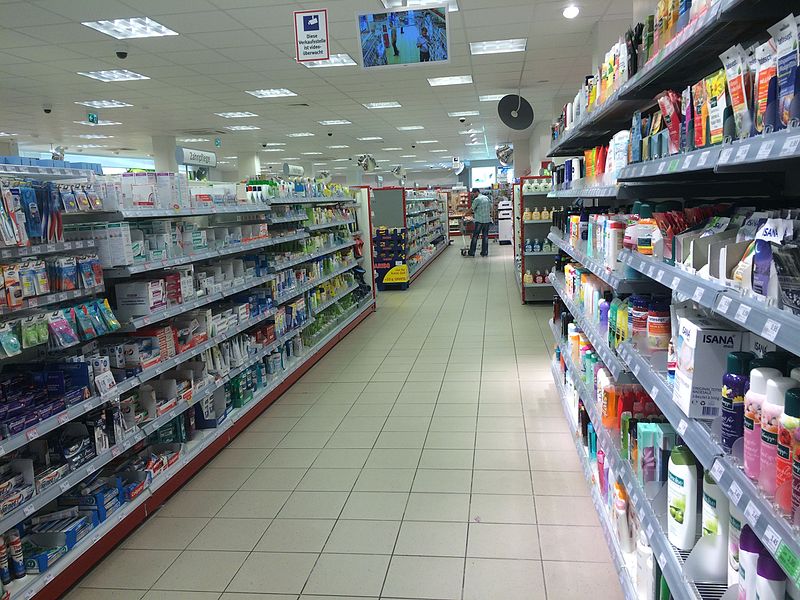
The photo Rossmann Innenansicht eines Ladens by Jan Hagelskamp1 is licensed under CC-BY 4.0
Before getting the solution, Rossmann store managers had to predict the daily sales and the number of customers for up to six weeks in advance; while store sales, in their turn, can be influenced by many factors, such as promotions, competitors in the area, school and state holidays, seasonality, and locality. As there were thousands of individual managers to predict sales based on their unique sets of circumstances, the accuracy of such forecasts was rather varied. Therefore, the task was to make a reliable sales forecast (including the number of customers and the average check) for 1,115 stores across Germany using which Rossmann store managers would be able to create effective staff schedules to increase their productivity and motivation.
Step 1 We were provided with historical sales data for 1,115 Rossmann stores. The data were provided in the CSV format, the selection contained 15 attributes, such as customers, assortment, store type, state holiday, sales etc.) We added attributes DAY and MONTH extracted from the data given (based on the timestamp). For the following hypotheses check we excluded the attributes, influence of which was obvious, e.g. if the store was open or closed on a particular weekday. As a result, every attribute left in the selection, made a hypothesis on whether this single attribute influences the number of customers and the average check.
Despite the fact we got the structured data, we used complex algorithms of data processing, as we had to carry out a large number of transactions.
Data scientist
Taking this into account, we proceeded to the next step – checking the hypotheses.
Step 2 We visualized the hypotheses, based on the attributes chosen, and made a conclusion that some of them did not influence the result, so they were excluded from the selection (e.g. On the other side, some hypotheses required the introduction of other parameters to get more accurate results. For instance, when we visualized the attribute STORE (all shops data), we got the data which showed that on Sunday Rossmann shops were attended by fewer customers than on the other days. However, when we included the attribute OPEN, it turned out that only a few shops were open on Sundays, and they were visited by a bigger number of customers than on weekdays. However, the average check was lower.
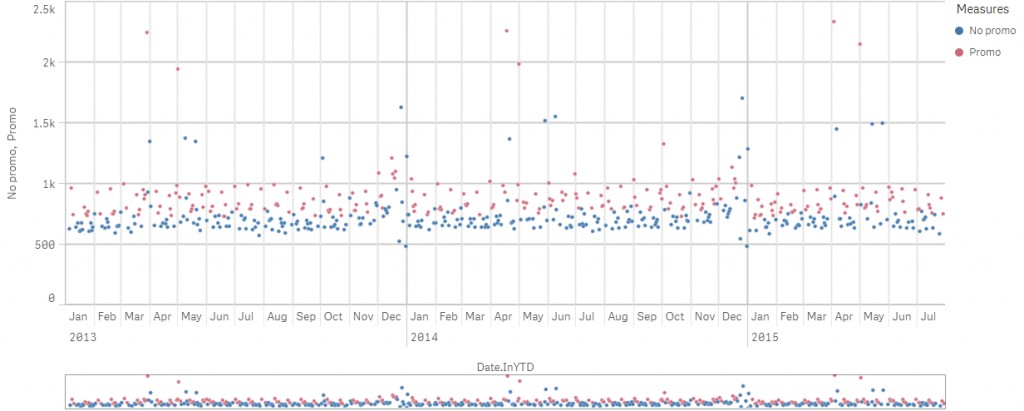
The graph shows how promo offers influence the sales
 Based on the examples described above, we made a conclusion that not all the given attributes influence the sales equally, so we made some corrections (added and excluded some attributes) and finally got 4 attributes which influenced the sales significantly. They were:
- promo – indicates whether a store is running a promo on that day;
- year/week- describes the year and calendar week;
- state holiday – indicates a state holiday;
- annual sales increase – shows how the sales increase each year.
When we were checking the hypotheses, we found quite a number of interesting facts and correlations which are not directly related to this task, but might be used by Rossmann marketing department.
Business analyst
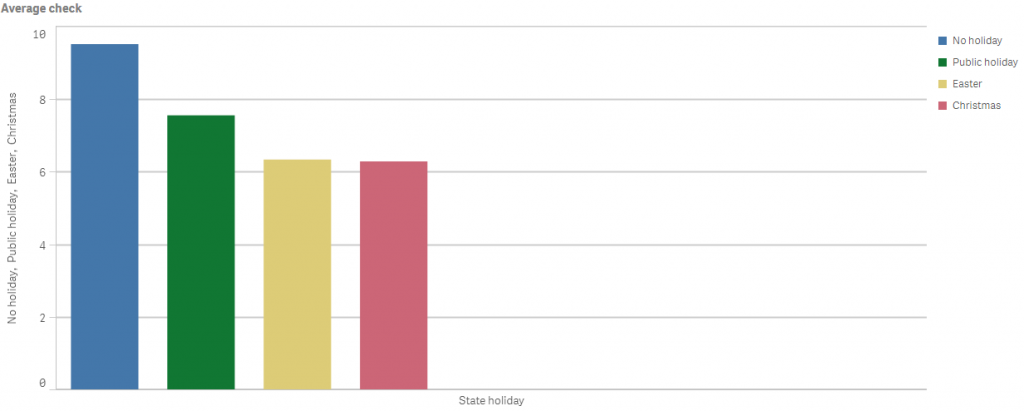
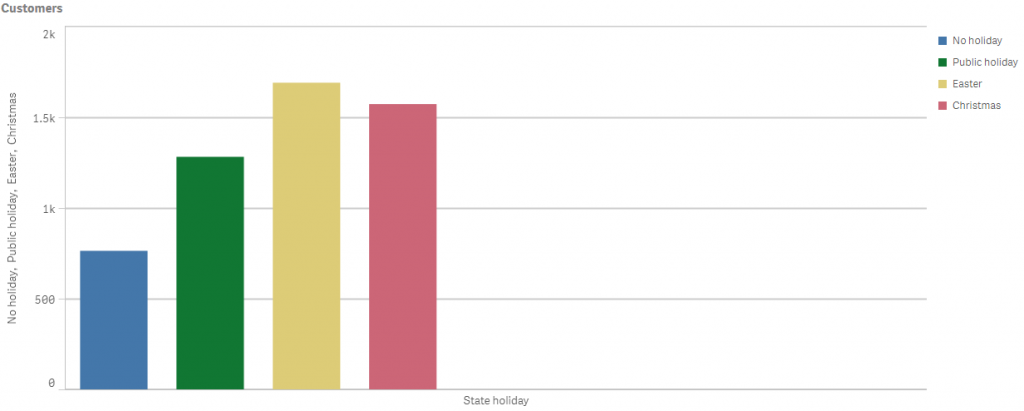
The graphs show how different holidays influence the number of customers and the average check

Step 3 Our next step was to choose a model type. At first, we tried a model of linear regression but it didn’t work out as it had a margin of error of 40%. Then we tried a model of a decision tree, however, the result was still inaccurate, so it ended up with a model of a decision forest which suited well for our type of data and the task given.
Step 4 The model was built and trained (here we used a scikit-learn library) and we had to make some adjustments in order to improve its training result and thus to increase its accuracy. To increase the accuracy, we had to change the model we trained. We could do it by using lognormal distribution instead of a usual one to get the required accuracy. With the adjustments described above, we got a result of 88% accuracy, which we found satisfactory for that very business task, while could see the ways of further improvement.
Acquiring the required accuracy is a time consuming process, as it is always necessary to optimize a machine learning algorithm and check the result. Although we have reached 88% accuracy, the result can be improved if there is more time.
Data scientist
As a result, we have created a model, using which Rossmann store directors can predict sales for 6 weeks in advance (due to the number of customers and the average check).
Following on from this prediction they will be able to create an effective schedule for their employees.
The graph shows the difference between the actual sales and the predicted ones for a selected calendar month
 Our next step might be the creation of a visual interface for predicting sales, so it will be possible to enter a random weekday e.g. the first Tuesday of June 2017 and predict how many customers will attend the exact store and how much money they will spend there.
